Energy prices have picked up from the low levels of last autumn. Commentary on recent rises in man-made fibres has noted the rising energy prices, attributing the strength of man-made fibre prices as a partial consequence. This article takes a look at oil and a sample of apparel fibre prices.
Oil has a complicated relationship with apparel fibres. On the one hand it is the ultimate feedstock for many fibres including the gorilla of fibres, polyester. On the other hand it can influence demand by acting as a form of wealth transfer between oil producer and consumer countries (where most of the demand for apparel resides). On top of these sometime competing influences, the supply chain for man-made fibres is quite complex. Consequently the relationship between oil prices and derivative compounds varies.
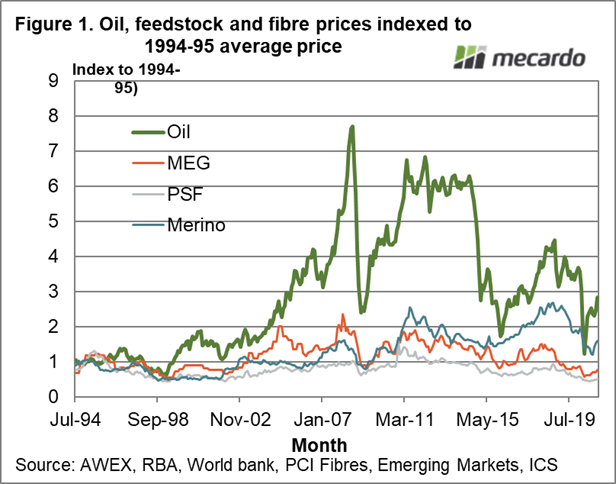
In Figure 1 price series for oil, MEG (a feedstock for polyester), polyester staple fibre (PSF) and merino wool are shown from the mid-1990s onwards. The prices series have been indexed to their average prices for the 1994-95 season, in order to allow a reasonable comparison in one graph. The strength of the oil price stands out, from the early 2000’s onwards with a couple of big falls in price in 2008, 2016 and 2019-2020. The question for the article is how useful is a change in oil prices in determining the likely change in man-made apparel fibre prices and even further on from that, in merino wool prices. Figure 1 suggests there are periods when oil and the apparel fibres track each other.
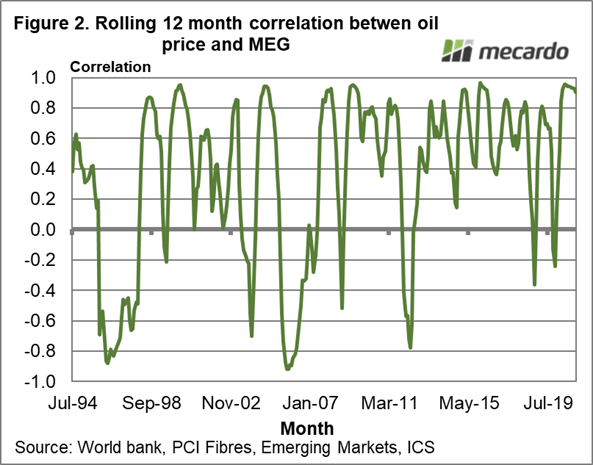
To look at this more closely a comparison of oil and the three other series is shown. In Figure 2 the rolling 12 month correlation between oil and MEG is given. If the correlation is very close and positive (like rainfall and fibre diameter) then the series in figure 2 should stay up close to one. If the series are negatively correlated (like world sheep numbers and sheep meat prices) then the series in Figure 2 should be low, close to minus one. If there is no correlation between the two price series then Figure 2 should be around the middle, zero. The correlation in Figure 2 is variable, although in the past decade it has spent more time in the positively correlated area. It is not a given however that where the oil price goes, MEG will follow.
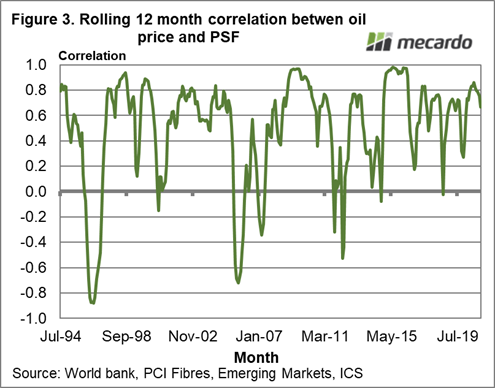
In Figure 3 the process is repeated for oil and polyester staple fibre. It is a similar story to Figure 2, but not the same. The PSF price tends to oscillate between being highly correlated with the MEG price and having no relation for brief periods, hence the slight differences between Figure 2 and Figure 3.
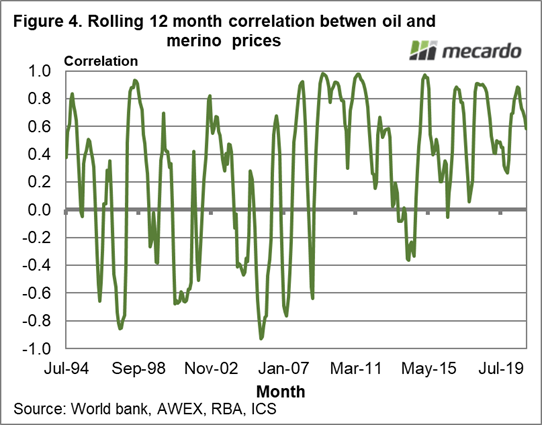
To round out the article Figure 4 shows the rolling 12 month correlation between oil and the merino price. As expected the correlation varies greatly, swinging up and down, although it has spent more time in the positive correlation area during the past decade. The outcome of such varied correlations is that oil prices on their own do not provide reliable useful information for the apparel fibre market.
What does it mean?
Often in a news bulletin comment will be made about some factor which has caused a market to move by a small amount; impossible to prove or disprove but everyone feels better because the world is a little less mysterious. Oil prices tend to be used in the fibre markets in a similar fashion. In reality the correlations between oil prices and feedstock/apparel fibres prices are too loose to warrant spending too much time using oil as a guide to apparel fibre market.
Have any questions or comments?
Key Points
- The relationship between oil prices and apparel fibre prices (and their intermediate feedstocks) is highly variable.
- This variability limits the usefulness of oil prices for analysing the apparel fibre markets.
Click on figure to expand
Click on figure to expand
Click on figure to expand
Data sources: World Bank, RBA, AWEX, PCI Fibres, Emerging Markets, ICS , Mecardo


