")
Mecardo was contacted recently about data for Australian commodities for the second half of the nineteenth century. The comment was made that finding historical data series was difficult so in this article Mecardo will publish details of some sources of historical data.
When looking for historical data there are three pieces of data usually required. They are the actual data series, usually an exchange rate by which to convert the price series to the appropriate currency and finally a deflator, which adjusts the historical data for inflation. To the writer (this is a subjective assessment) it seems that historical data has moved from being relatively cheap to being relatively expensive and now is becoming cheap again, during the past three decades. The sources of data shown below does not pretend to be an exhaustive list, but does prove a good start if you are looking for data.
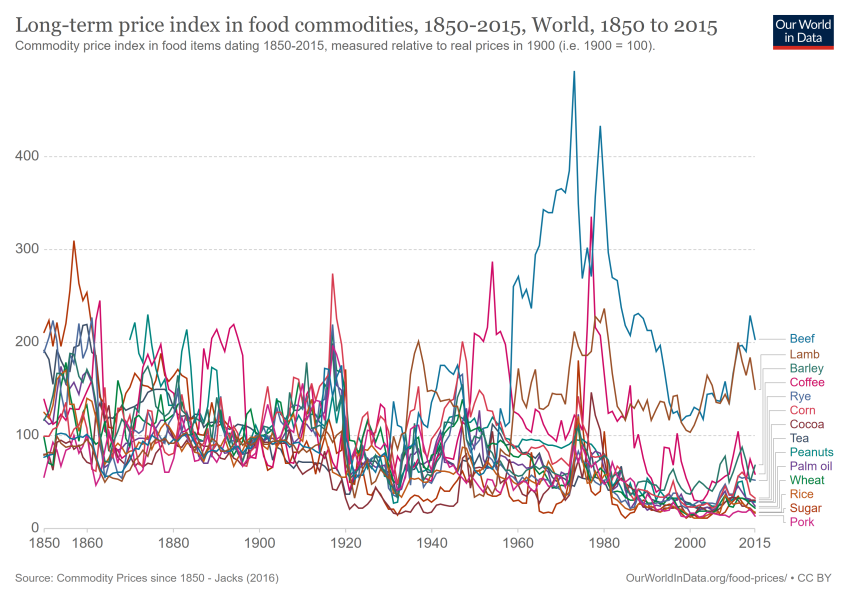
For graphical presentation of historical data, Our World in Data (WID), has a fantastic graphic, showing various commodity prices from 1850 onwards. A static screen shot of this graphic is shown in Figure 1. For those chasing lamb price data keep in mind the series shown here is based on the UK Smithfield market, which looks to have some significant variations from Australian series. This is a reminder to check the data is appropriate for your required use. David Jacks provides the data used in the WID graphic. The data is presented in deflated USD terms.
For earlier data the Allen-Unger website provides a wide range of commodity price series from the middle ages onwards. Another free website providing commodity prices (amongst other series) from the middle ages onwards is the International Institute of Social History. Global Financial Data is a fee based service with an extensive array of series stretching back to as far as the middle ages which has been operating for decades.
For the shorter term (1960 onwards) the World Bank provides monthly updates for an extensive array of commodity prices and indices.
Global Financial Data has a wide range of exchange rates, extending back beyond what is generally available for free on the internet.
Deflators for the past century are available from the US Federal Reserve.
Longer term deflators have been supplied to the writer from the Reserve Bank of Australia for 1850 onwards and from the Bank of England Bank for the middle ages onwards.

What does it mean?
There is a surprising amount of historical price data available on websites, with many providing the data for free (sometimes asking for a donation). In terms of commercial providers, Global Financial Data has been providing good quality data since the mid-1990s for commodity prices, exchange rates and a range of other financial data. For anyone seeking historical price data, this article should get you off to a good start. Finally there are the major libraries, with original source material, as a backstop resource.
Have any questions or comments?
Key Points
- There is a wide range of long term data available on the internet, much of which is free.
- Some information, such as deflators, may involve contacting the like of the Reserve Bank of Australia.
- For data which is not available on the free sites, Global Financial Data provides good quality long term data for a fee.
Click on graph to expand
Data sources: Various, ICS, Mecardo