The latest World Agricultural Supply and Demand Estimates (WASDE) report was released by the United States Department of Agriculture (USDA) last week, and while it had few surprises, it showed world wheat stocks continuing to dwindle.
The WASDE is one of the most closely followed publications in world
grain markets. The USDA are not always
right, but they have a good handle on what is happening in many of the worlds
major grain markets.
Last week’s October WASDE saw global wheat production decline a further
4mmt, with the USDA finally realizing that Australia wasn’t going to produce an
average crop. Even so, the 26mmt the
USDA pegged Australian production at might still be a little high. As outlined in Friday’s comment (view here), the
USDA is likely a little low on Russian production, which will offset any
further falls here.
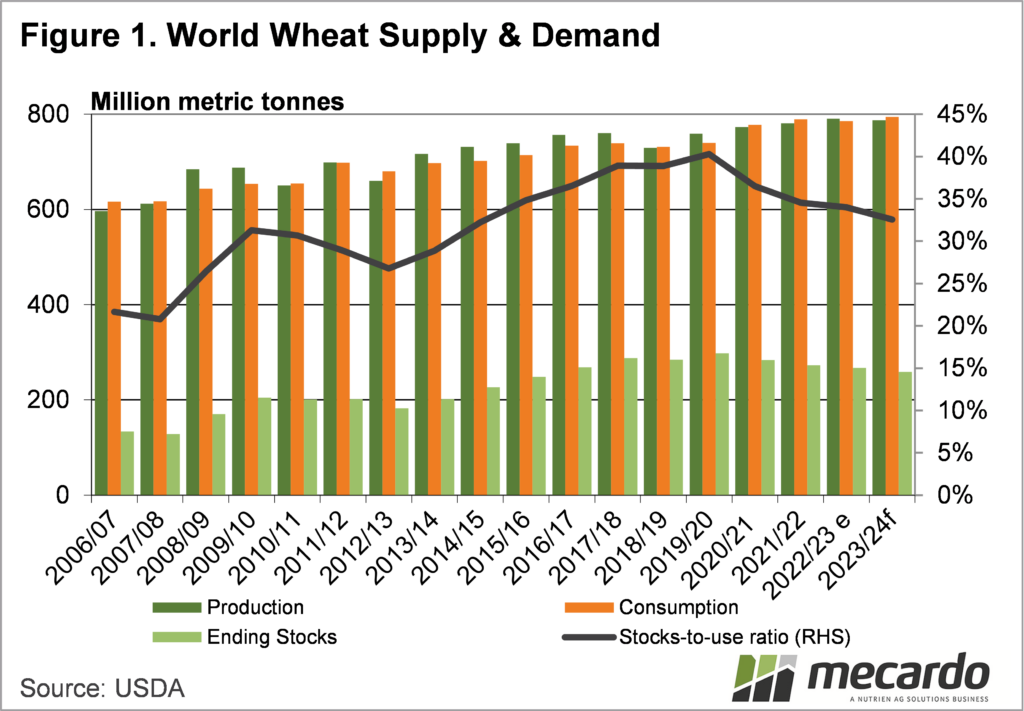
Figure 1 shows world wheat supplies are forecast to fall to an eight
year low in 2023/24. Over the period,
consumption has been on the rise, so the stocks to use ratio is forecast to hit
32.6%, also an eight year low.
Less than half the world’s wheat stocks are held outside China. Chinese
stocks are relatively stable, so the actual wheat stocks available to the rest
of the world have declined further than you might have thought.
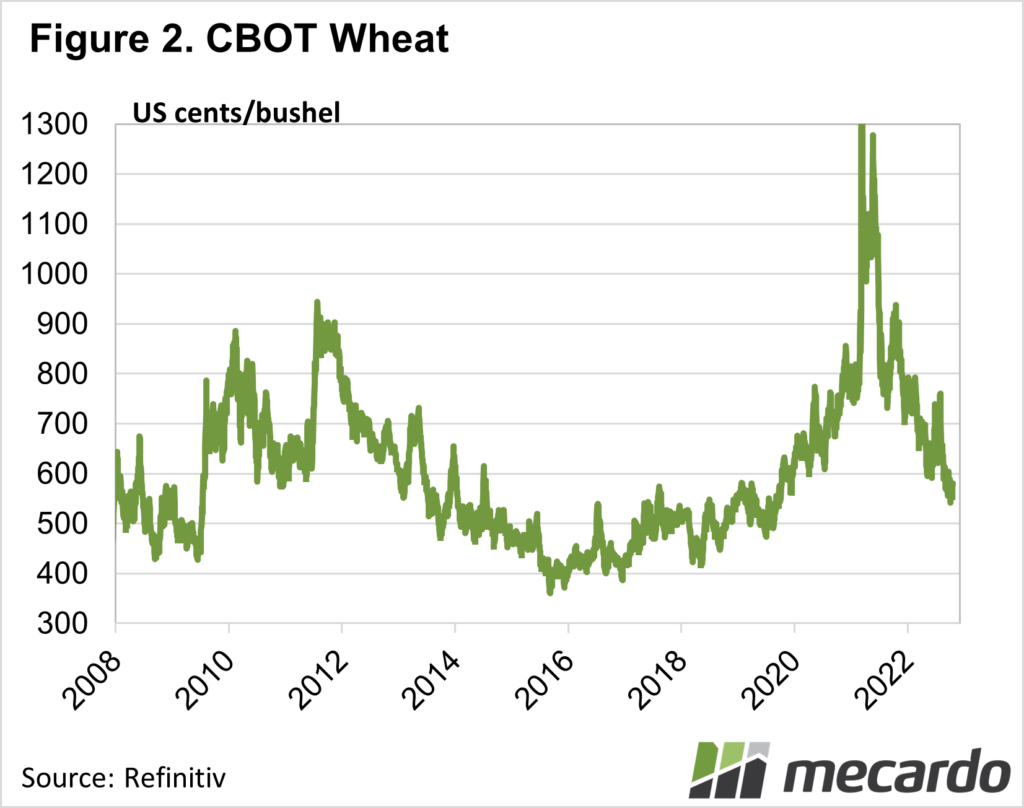
Looking at long term prices, and going back to 2014-15, (last time the
wheat stocks to use ratio was at 32%), we can see prices in US terms were at
similar levels. At that point, world
wheat production was on the rise, easily outstripping consumption, but coming
off some lows. Hence prices were
trending downwards and kept going.
The current situation is a bit different, prices are trending down, but
it was from an artificial high brought about by the Russia/Ukraine war. It’s unusual to have world stocks trending
lower, and prices trending lower at the same time.
Obviously,
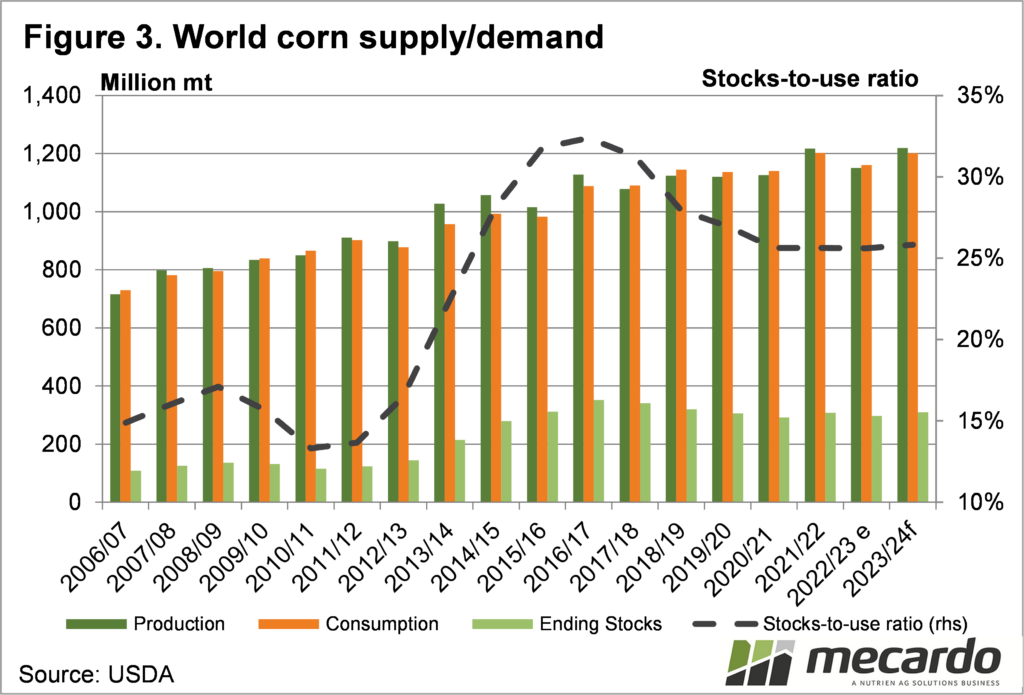
wheat markets don’t operate in a bubble, with corn being a major substitute in
feed markets, and a much larger world crop.
Figure 3 shows corn stocks are expected to increase this year, which is
keeping a lid on feed grain prices in general
What does it mean?
Figure 2 shows SRW is showing a classic symmetrical up and down
chart. Perhaps speculators are selling
on the expectation that prices are heading towards the 400¢/bu lows of 2019.
Fundamentals don’t really support
this, and tighter supplies should see markets kick at some stage, and carry into better prices in the medium term.
Additionally, any supply scares, or worsening growing conditions in major exporting countries, will see a sharp rally.
Have any questions or comments?
Key Points
-
· The USDA WASDE report pegged wheat supplies a little lower this month.
· World wheat stocks are expected to hit an 8 year low.
· Wheat prices have been trending lower, but are primed for a rally, with stocks being low.
Click on figure to expand
Click on figure to expand
Data sources: USDA,CME, Mecardo


