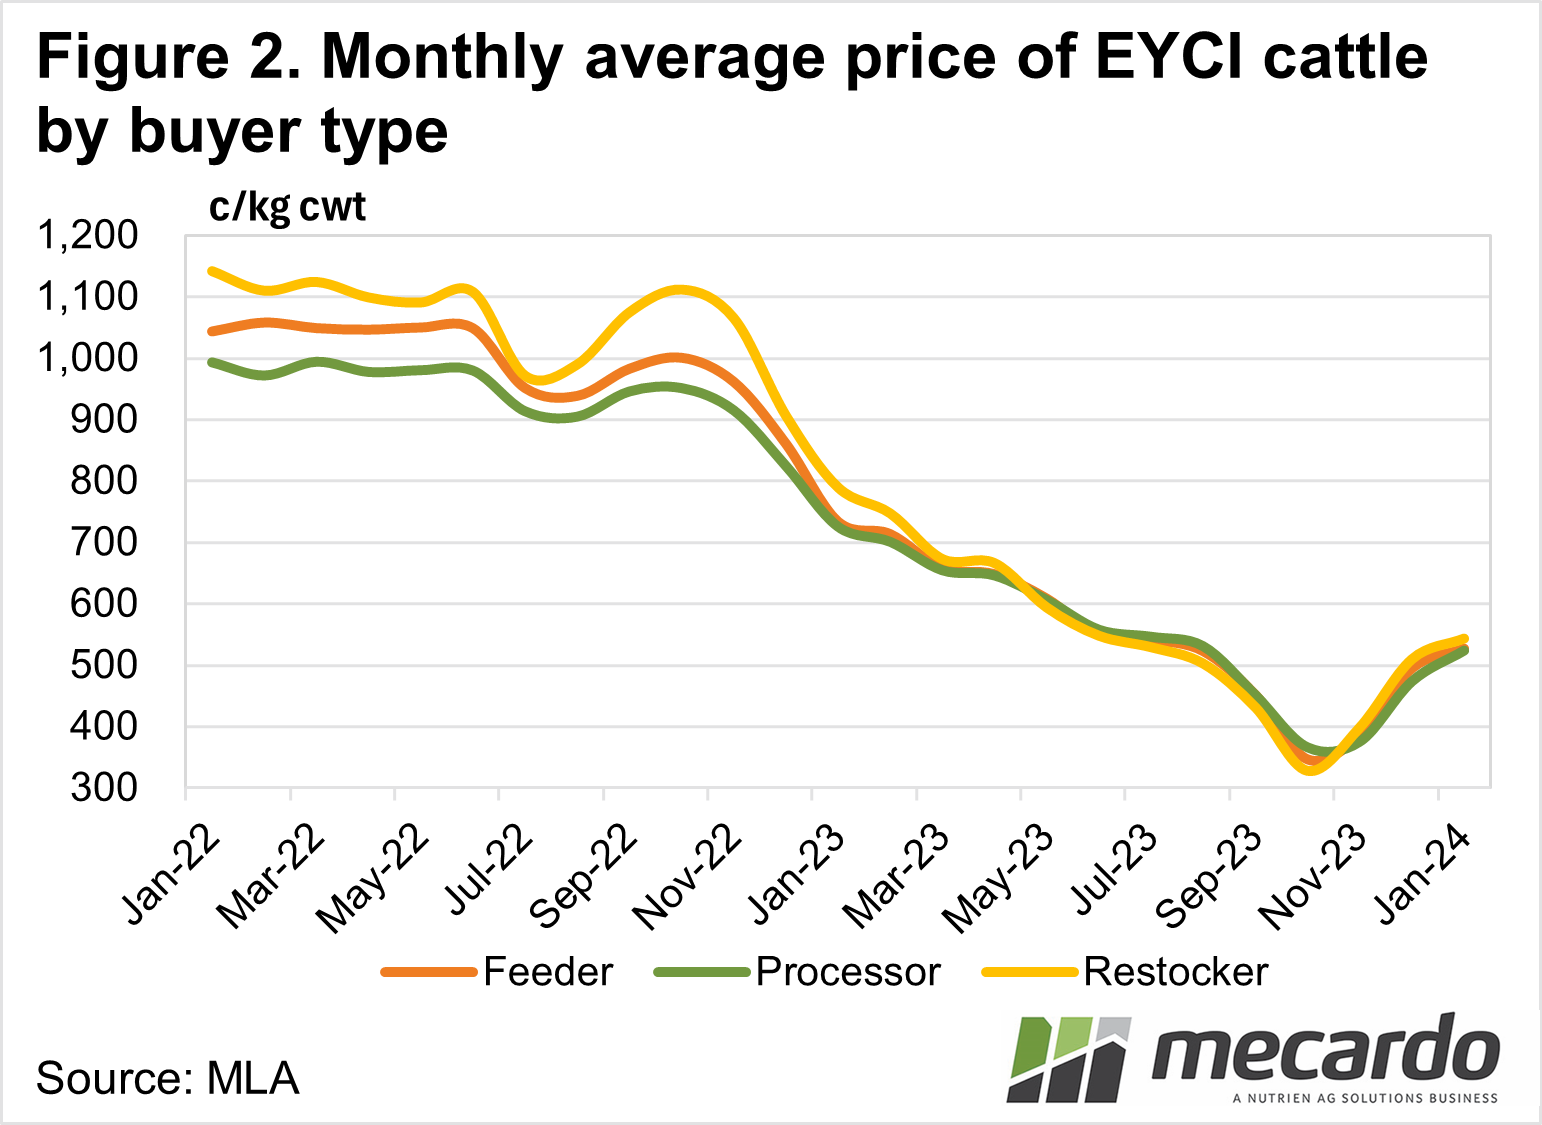
Looking at the EYCI (Eastern Young Cattle Indicator) it’s a refreshing sight to see a positive gradient, after what has been a long downward slide. The 4th quarter rally seen in prices bought with it a record number of throughput, as producers looked to cash in on the price rally. Despite the sudden influx of supply, however, the price didn’t buckle meaning that demand must’ve shifted to the right as well.
The EYCI was created to show the overall trend in the cattle market as a
result of varying demand and supply drivers. According to the MLA fact sheet on
the EYCI, the “average buyer breakdown for the total share of eligible cattle
has consisted of 47% feedlotters, 38% restockers, and 15% processors”.
Since its low of 349 c/kg in mid-October,
the EYCI has climbed 71% to just shy of 600 c/kg in the opening weeks of 2024. One
of the initial drivers for the price increase was tighter supply. 2023 November
headcount numbers for EYCI eligible cattle were down 20% (20.7k) on the average
for November since 2019. This is in line with the trend in total cattle
yardings for the month of November 2023 which was down 19% on the five-year seasonal
average.
The price rally that began in November,
spurred on by the widespread rain on the East Coast, in turn, drove an influx
of numbers through the yards in December. The number of EYCI-eligible cattle was
up 38% (35k head) on the December average. This increase in supply however
didn’t wipe away the price gains.
Prices were able to continue their upward
trajectory through December thanks to an increase in demand from feedlotters
and restockers, which as mentioned above dominate the buying share of the EYCI.
Feeders took 47% (20.8k head) more cattle in December last year compared to the
five-year December average and restockers up 51% (16.5k) on the December
five-year average. The buyer breakdown averages shifted slightly towards the
feeders in December 2023, up 4% to an average of 52% of the total eligible
cattle amount.
Restockers traditionally have had a relatively
higher willingness to spend than feedlotters, spending on average 4% (25 c/kg)
more for EYCI cattle than the feedlotters do in the August to December period. This
year however, feedlotters narrowed the margin, with restockers paying a 3% premium
in November (13 c/kg) and December (15 c/kg). So far in January, the difference
in spending between feedlotters and restockers has swung wider, with restockers
paying a 6% (39¢/kg cwt) premium over feedlotters for young cattle.

What does it mean?
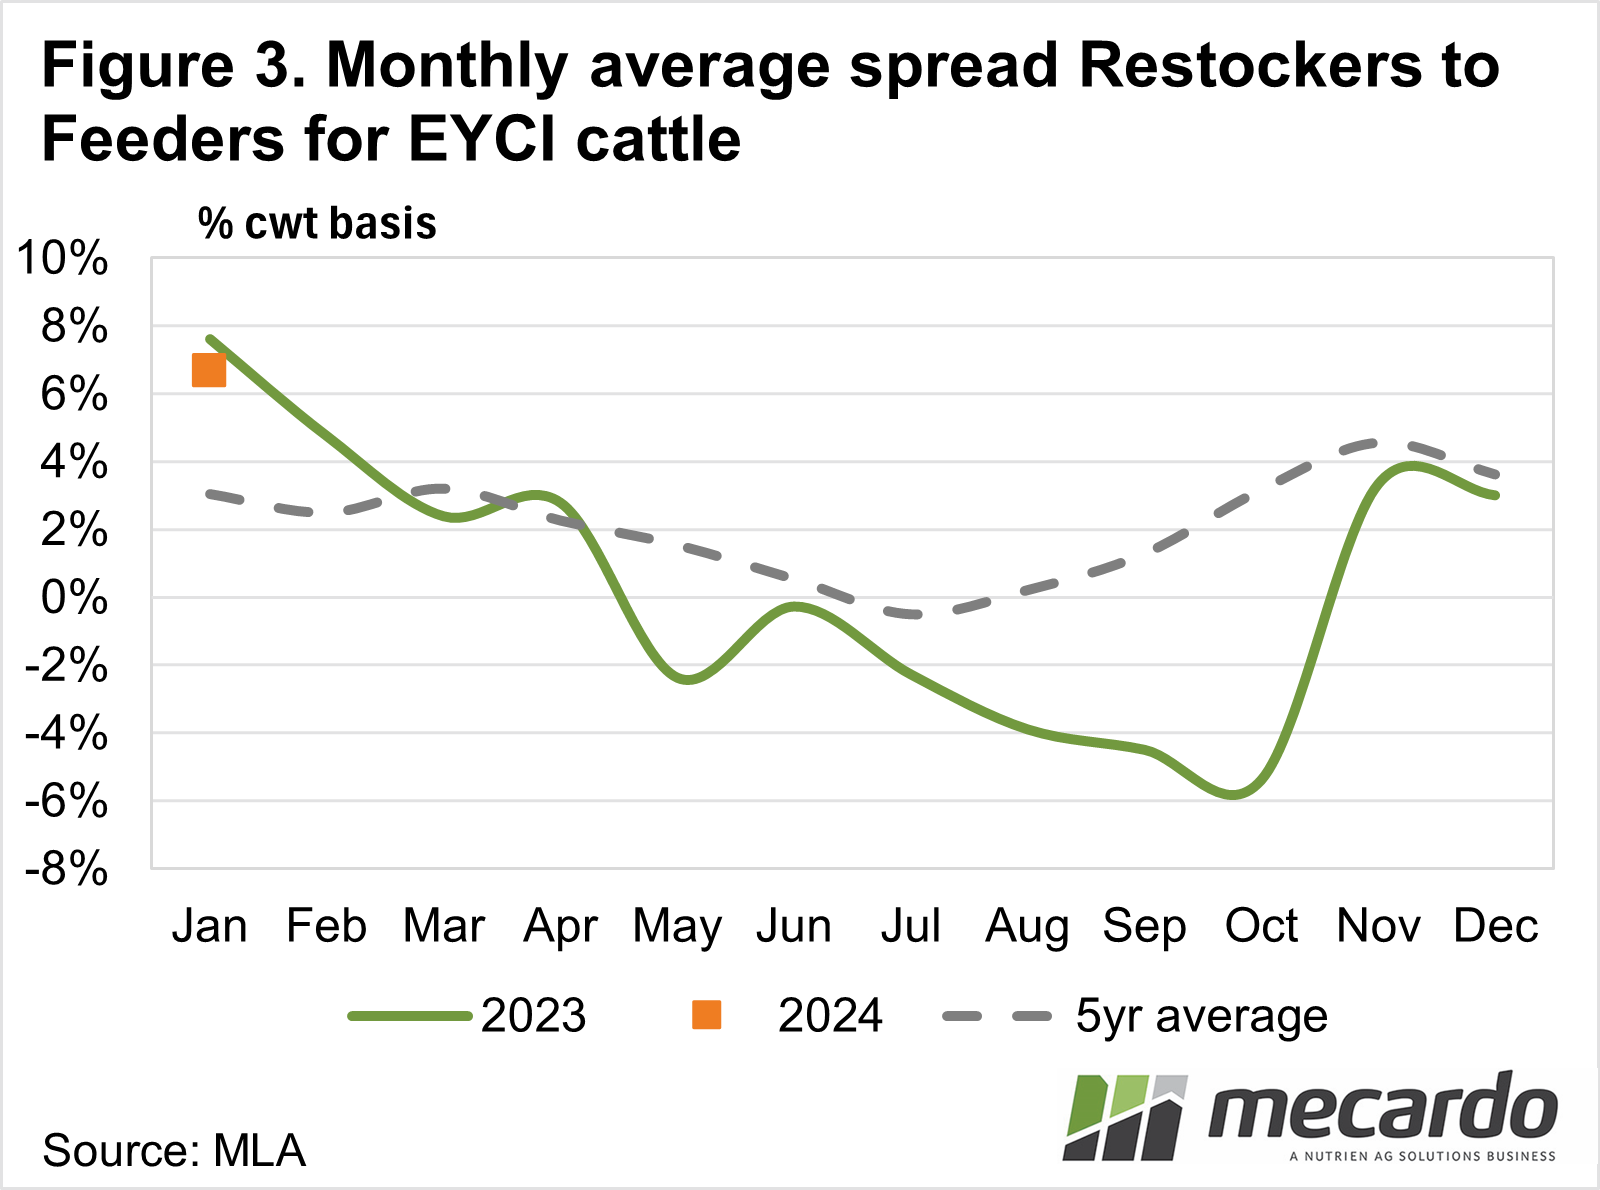
Plentiful supply afforded buyers the luxury of reduced competition, particularly coming out of northern NSW in the second half of last year. Figure 3 shows the reinvigoration of saleyard competition and restocker appetite in the market come November and December.
The improvement in local seasonal conditions and a wetter outlook in 2024 has changed the view of restockers, but there are also positive signs that lotfeeders are gaining more confidence. For prices to continue on their upward trajectory, however, we expect some more support from overseas demand will be needed.
Have any questions or comments?

Key Points
- Young cattle prices have improved 71% since the October lows.
- Despite record-breaking supply, recently strong demand has kept prices trending upwards.
- Feedlotters and Restockers have returned contributing to demand.

Click on figure to expand
Click on figure to expand
Click on figure to expand
Data sources: MLA, Mecardo