Sheep numbers are low (as the latest surveys and estimates point out) and from that wool production is also low in historical terms. It seems there is a line of thought which assumes logic of low wool production will underpin sustained higher prices (COVID-19 dips aside). This article suggests an alternative logic.
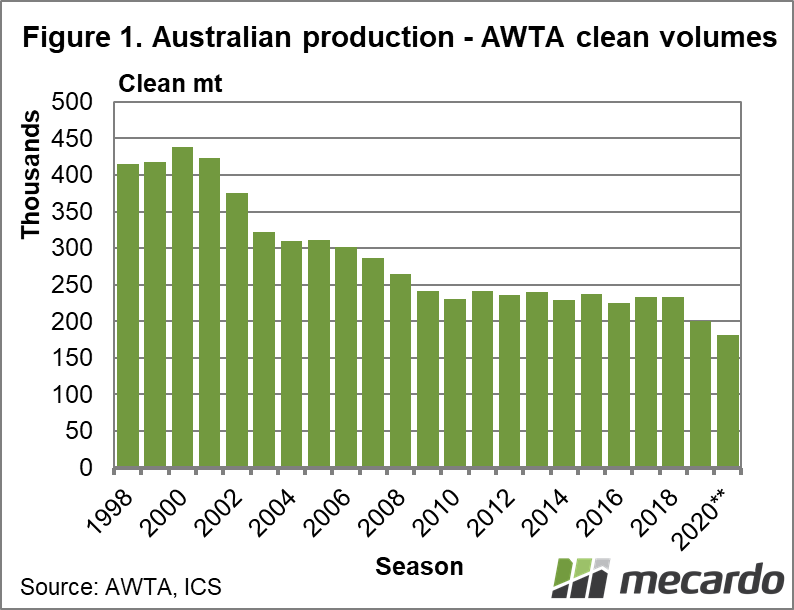
Sheep numbers, wool and sheep meat production are low by historical standards when viewed on a world perspective. Figure 1 shows the annual AWTA core test volume in clean terms, as a proxy for Australian wool production, from the late 1990s onwards with an estimate for the current season. As earlier Mecardo articles have discussed the main downtrend in production stabilised around a decade ago, but the recent run of drought years has pushed volume lower again.
When considering the relationship between price and supply, consideration must be taken that wool does not exist in a world of apparel separate from other fibres, some of which dwarf wool in terms of size and turnover such as cotton. One way to account for the effect of other fibre prices on the wool market is to compare wool supply with the price ratio of wool to other fibres. Figure 2 does this. It compares the supply of wool (as shown in Figure 1) with the price ratio of the EMI to the Cotlook Index (a proxy for cotton prices), using annual averages. This simple analysis shows a strong correlation between falling supply and higher price ratios.
Lower supply has led to a higher wool price relative to cotton, but not necessarily to higher wool prices. Mecardo showed last week that prices for merino, cotton and polyester staple had all fallen similar proportions since early 2020, as a consequence of lock downs due to COVID-19. In this scenario the effect of low wool supply can still be operating, with wool prices some 20% lower than three months ago.
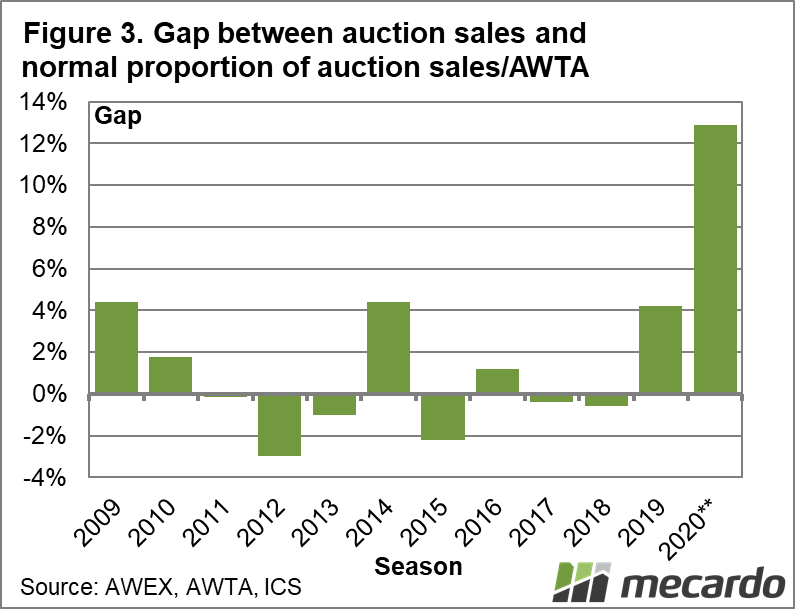
Two weeks ago Mecardo showed how in recent years auction sales volume had accounted for around 85% of AWTA core test volumes (view article). In Figure 3 the variation in the proportion of auction sales from 85% of AWTA core test volumes is shown from 2008-2009 onwards, with the season to date shown for the current season. The current season stands out with the gap between the normal 85% that sales account to AWTA volumes widening by 13%. In effect demand has shrunk, so that some 13% less wool has been required. The actual story is more dire still, as South Africa, New Zealand and Argentina have not been supplying wool in the recent months. The point of Figure 3 is to highlight the drop in demand and quantify it. This drop in demand is responsible for the drop in price in wool and other fibres.
What does it mean?
Low wool supply will help wool prices in relation to other apparel fibre prices (the old price ratios such as wool to cotton) but will not be enough to avoid wool prices following the general lead of apparel fibre markets, as seen in recent months. Stocks are rising for wool as demand shrinks, with cotton in a very similar situation.
Have any questions or comments?
Key Points
- Lower wool volumes have been correlated to higher prices ratios to other fibres such as cotton.
- When apparel fibre prices fall (as they have in 2020) wool prices follow, even with the price ratio effect of lower wool production still in operation.
- The increased gap between auction sales volume and the normal level of AWTA sold reflects the drop in demand due to COVID-19 lockdowns, seen in other fibres as well.
Click on graph to expand
Click on graph to expand
Click on graph to expand
Data sources: AWEX, AWTA, Cotlook, RBA, ICS


