
A Mecardo reader has asked about the volume of 18 micron wool production and at what level does the market for this wool reach saturation point. This article looks at this question.
While Australia is the main source of merino wool in the world it is not the only producer, a point ever more apparent with the developing demand for non-mulesed wool. Figure 1 shows the supply of merino wool in clean terms for the 2019-2020 season by micron category, data derived from a mix of auction and AWTA numbers. The “Other” merino volumes cover the major southern hemisphere wool exporters apart from Australia as well as estimates for China and across to Russia.
Some of the other regions provide good production data with which to build the micron distribution into a world micron distribution. South Africa supplies the best data by a country mile, with Argentina supplying a micron breakdown of wool exports in clean terms. For this purpose of this exercise an average micron for merino wool (taken as finer than 25 micron where there is no definite breed data available) is allied with either a calculated or estimates standard deviation so a theoretical distribution of wool by micron can be developed. For some regions, such as China and Russia, the available data is extremely limited. For China the official wool clip data has been ignored with unofficial estimates of “merino equivalent” used – these are much lower than the official clip size which includes all grades of wool.
Given the above caveats regarding the calculations used to estimate merino production by micron category, the 18 micron volume is around 40 million clean kgs which translates into around 350,000 farm bales. The supply of 18 micron wool is relatively stable as it is now within a micron of the average merino fibre diameter in the Australian clip.
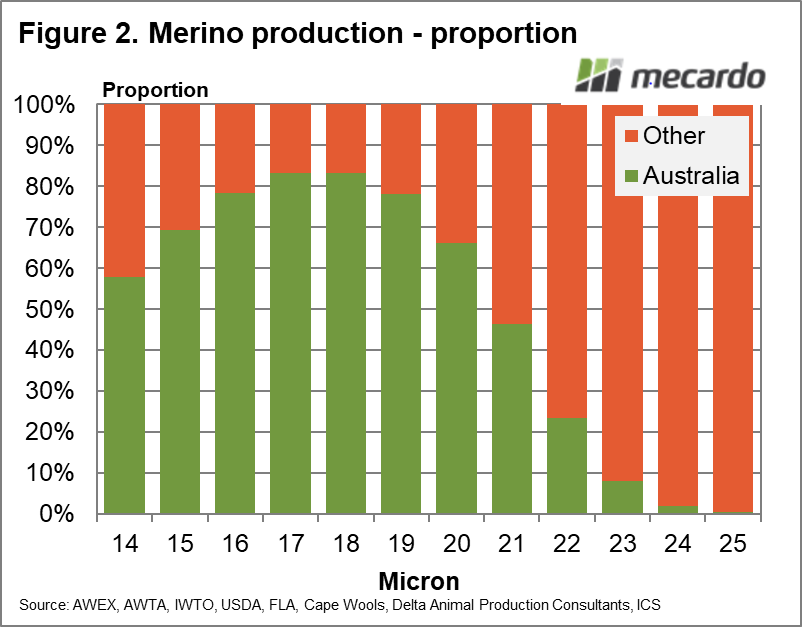
Figure 2 shows the same data as in Figure 1 in a different fashion, showing the proportion of production for each micron category which comes from Australia. For the 17 and 18 micron categories the proportion creeps above 80%. It falls away on the broader side of the distribution, so that by 22 micron Australia is now accounts for only a quarter of supply.
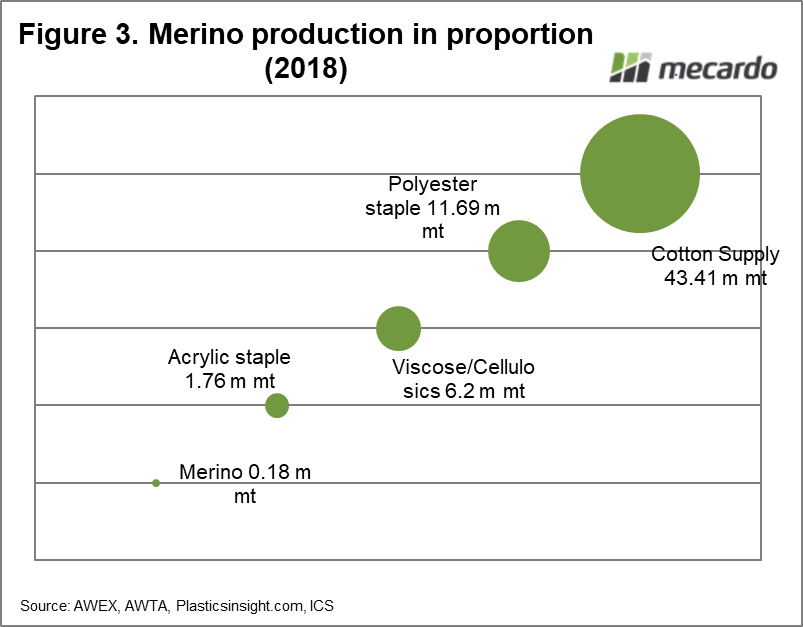
To put the merino production in context, with regards to considering a saturation point for 18 micron wool, Figure 3 uses bubble size to compare the volumes in merino, acrylic, viscose/cellulosic fibres, polyester staple and cotton. This is the order of size of volume. The data is primarily for 2018, and keep in mind cotton supply is production plus stocks. It is a simplistic way of looking at potential markets for wool but it highlights that there is plenty of scope for wool in the apparel fibre world.
This is not to say that changes in volume have no effect on price. Changes in wool volume do have an effect on price but it is best seen through its effect on price relative to other fibres. Mecardo looked at this earlier in the year, considering the correlation between changes in merino volume and change in the merino to cotton price ratio through time (view article here).

What does it mean?
The original question seemed to originate from a concern as to whether demand can absorb current production of 18-micron wool. Beyond the season to season swings in wool production due to changes in seasonal conditions, wool supply tends to change steadily which gives the supply chains time to adapt (if they are not driving the change). In the past three decades falling merino supply has underpinned rising price ratios to the likes of cotton and polyester staple fibre. If 18 micron volumes were to increase structurally in the coming decade there is ample demand to absorb the extra volumes, but the relative price of wool to other fibres would probably ease.
Have any questions or comments?
Key Points
- Australia accounts for the majority of 20 micron and finer merino production in the world.
- In relation to the major apparel fibres merino wool volumes are quite small, so the question of market saturation does not seem to be an issue.
- Longer term change in the supply of merino is correlated with change in the price of merino relative to other fibres.

Click on figure to expand
Click on figure to expand
Click on figure to expand
Data sources: AWEX, AWTA, IWTO, USDA, FLA, Cape Wools, Delta Animal Production Consultants, Plasticsinsight.com, ICS, Mecardo.


