")
This article follows on from one earlier in the week, which was a preliminary look at the volume and value of wool produced in northern Queensland (which by volume is mainly central west Queensland). Wool out of this region matches up to the average merino production out of Australia except for one intriguing aspect.
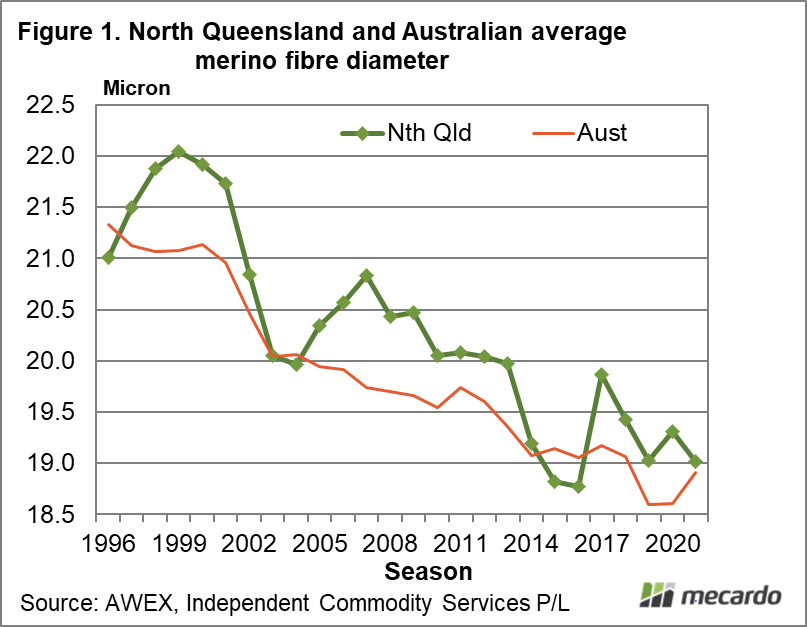
Figure 1 shows the seasonal average fibre diameter for northern Queensland wool sold at auction and the Australian merino woolclip, from the mid-1990s to the current season (to date). It shows the northern Queensland clip tends to be broader than the average Australian merino clip by around 0.4 micron.
When the price differential between the two series is calculated using AWEX eastern MPGs, it shows that since 2002 the price difference due to fibre diameter to be 3.2%, which explains the bulk of the northern Queensland average clean price discount to the national merino price (see earlier article from this week). This implies that all the other quality characteristics which make up the wool from northern Queensland in total account for a discount to the national merino value of 0.3%, effectively meaning the northern merino clean value per kg matches the national average value when adjusted for micron.
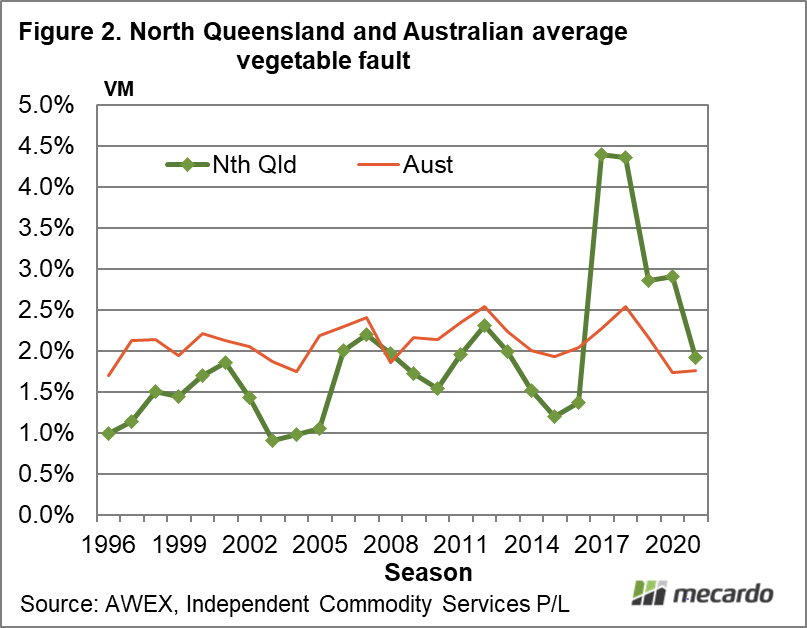
What about the other wool characteristics? Figure 2 shows the average vegetable matter (VM) fault for the northern Queensland clip versus the Australian clip average, with the northern Queensland levels usually below the average Australian level.
Figure 3 compares the proportion of the northern Queensland wool sold at auction declared as CM or NM (ceased or non-mulesed) from 2008-9 onwards to the current season to date, with the proportion of Australian merino wool declared as such. The proportion of CM-NM wool coming out of northern Queensland is surprisingly high, having risen strongly since 2016-2017. This level of CM-NM wool is only beaten (in merino wool) by southern Queensland, followed by Tasmania in third place.

What does it mean?
The clean value of the northern Queensland clip, when adjusted for fibre diameter, effectively matches that of the national average gross value. From a price perspective on average wool from central west Queensland matches that of the rest of Australia. In terms of CM-NM declarations, northern (and southern) Queensland is well ahead of the average Australian levels (by an order of three). There is a separate story in this alone.
Have any questions or comments?

Key Points
- The northern Queensland clip (97-99% merino) tends to be around 0.4 micron broader than the national average merino micron.
- When the average clean price is adjusted for the broader micron, the average northern Queensland gross value is well within 1% of the national average merino clean price.
- The proportion of wool declared as CM-NM in northern Queensland is nearly triple that of the national average.
Click on figure to expand
Click on figure to expand

Click on figure to expand
Data sources: AWEX, ICS, Mecardo


